Change Readiness & Adoption Metrics: What to Measure & Why
 ACTSol and Associates
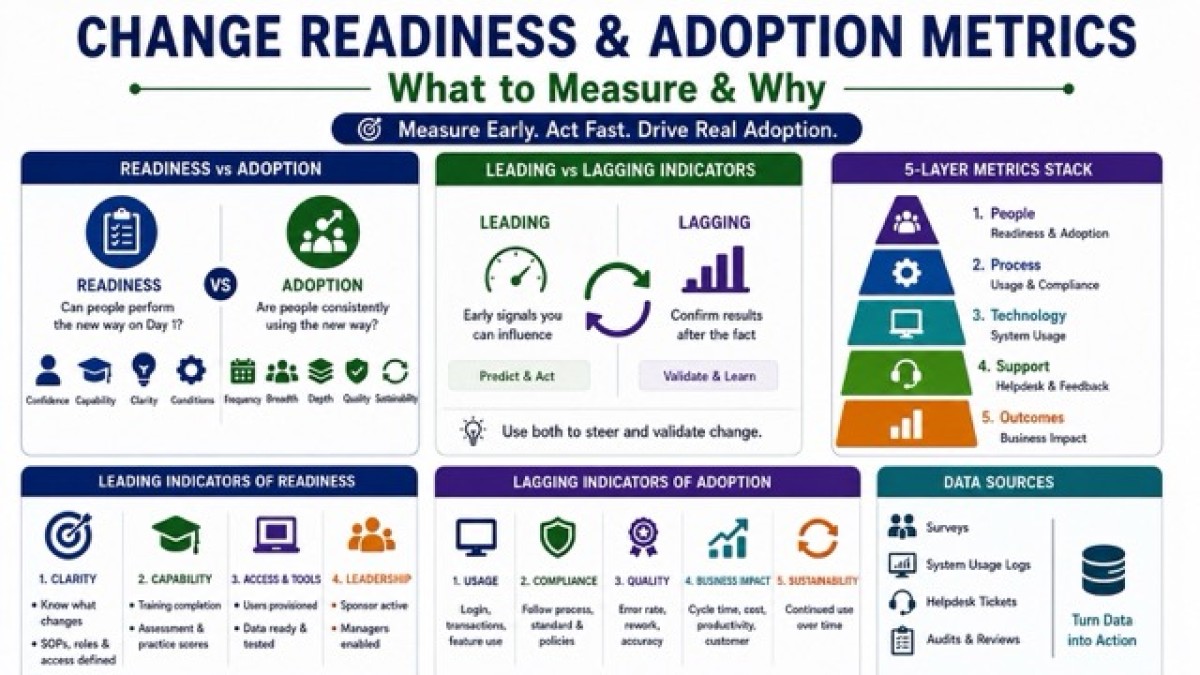
Measure readiness and adoption deliberately—what to track and why it matters.

Most change programs fail in a very predictable way.
Executives feel busy. They sound confident. They have decks, workshops, training calendars, comms plans, and "launch dates." And then… real work starts. People revert. Workarounds appear. Usage becomes cosmetic. The business quietly absorbs the cost of "almost adoption."
That's why readiness and adoption metrics exist. Not to "report progress." To detect risk early, correct the course fast, and prove value credibly.
If you can't measure readiness, you can't time your go-live intelligently. If you can't measure adoption, you can't tell whether people are using the change or merely surviving it.
This article gives you a practical, field-tested way to define leading and lagging indicators of readiness and adoption, and then use survey data, system usage logs, helpdesk tickets, and audits to refine interventions—before small problems become "culture problems."
Readiness vs. Adoption: Stop Mixing Them Up
Change readiness answers: "Can people perform the new way of working on Day 1?" It's the pre-condition.
Change adoption answers: "Are people consistently performing the new way of working in real conditions?" It's the behaviour.
A team can be "trained" and still not be ready. A system can be "live" and still not be adopted.
Practical definitions you can use
- Readiness = Confidence + Capability + Clarity + Conditions
- Confidence: "I believe I can do it."
- Capability: "I have the skill and practice."
- Clarity: "I know what changes for me."
- Conditions: "Tools, access, job aids, approvals, data are in place."
- Adoption = Frequency + Breadth + Depth + Quality + Sustainability
- Frequency: how often used
- Breadth: how many people/teams use it
- Depth: how much of it they use (features / steps)
- Quality: correctness and compliance
- Sustainability: continued use after novelty fades
Leading vs. Lagging Indicators (Simple but Critical)
Leading indicators are early signals you can influence before outcomes show up. They are predictive, imperfect, but actionable.
Lagging indicators confirm whether the change produced results after the fact. They are precise, but slow.
A strong measurement system uses both:
- Leading indicators to steer
- Lagging indicators to validate
Use this 5-layer stack to avoid random metric collections:
Rule: If you jump straight to outcomes, you'll argue forever about why outcomes didn't move.
Practical Leading Indicators of Change Readiness
Readiness is not a feeling. It's measurable. Here are leading indicators that hold up in real programs.
Role-level clarity indicators. Measure whether people know what changes for them.
What to measure
- % employees who can correctly answer:
- "What stops, starts, continues for my role?"
- "What does 'good' look like in the new process?"
- % Teams with updated SOPs / work instructions available at point of use
- % Roles with updated RACI / approval limits / access rights defined
Example: A finance transformation updates approval limits.
Survey shows: "I know my new approval authority" = 42% in one region vs 78% elsewhere. That region will create delays and escalations post go-live. You don't need to wait for the delays.
Intervention: Targeted manager huddles + one-page "authority matrix" + scenario drills.
2) Capability indicators (training that predicts performance). Training completion is weak. Capability is stronger.
What to measure
- Training attendance and completion (basic)
- Quiz / pass rates by role (better)
- Practical simulation scores / hands-on tasks (best)
- "Confidence to perform top 5 tasks" (self-assessed) + manager-assessed
Example: A CRM rollout trains sales teams. Completion = 95% (looks great). But simulation: "Create opportunity + attach proposal + stage update" pass rate = 54%. That is a Day 1 failure waiting to happen.
Intervention: Role-based practice labs, not more slide decks.
3) Access & tool readiness indicators. Many "people problems" are actually access problems.
What to measure
- % Users provisioned (accounts created, roles assigned)
- % Users logged in at least once pre-go-live
- % Users with required devices / network/VPN stability
- Data readiness: % master data validated; duplicate / error rates in key fields
- Cutover rehearsal pass rate, UAT defect density, defect aging
Example: In an ERP launch, "user provisioned" = 98% but "role permissions correct" = 71%. That gap becomes a helpdesk explosion on Day 1.
Intervention: Permission audits + "critical role test scripts" + early pilot access.
4) Sponsor and manager readiness indicators. People follow their immediate leader's cues.
What to measure
- Sponsor activity index:
- Visible touchpoints (townhall, site visits, videos)
- Decisions removed / blockers cleared
- Speed of decision cycle time
- Manager enablement:
- % Managers briefed with toolkit
- % Managers conducting team huddles
- Quality score of huddles (pulse checks)
Example: A program has strong comms, but managers avoid talking about workload trade-offs. Pulse shows "My manager discussed what we will stop doing" = 18%. People assume it's "extra work," resistance rises.
Intervention: Manager scripts + workload negotiation template + stop-doing list.
5) Sentiment and risk perception indicators (without drama). Sentiment matters—but only when connected to action.
What to measure
- Perceived impact severity (time, complexity, risk)
- Fear themes: job security, performance, loss of autonomy
- Trust indicators: "Leadership will support us during transition"
- Change saturation index: how many changes hitting the same group
Example: Helpdesk isn't even live yet, but survey shows "I believe this change will make my work harder" = 64% in Operations. That predicts workaround behaviour.
Intervention: Show process time savings with real examples, remove low-value steps, and publish "what we simplified."
Practical Leading and Lagging Indicators of Adoption
Adoption is behaviour. Start measuring it the moment real work begins.
Adoption leading indicators (early behaviour signals). These show whether adoption is starting.
What to measure
- First-time actions:
- % target users performing key transaction at least once
- Time-to-first-success:
- median days from go-live to first correct completion
- Drop-off points:
- where users start but abandon (e.g., saved drafts, incomplete cases)
Feature / step utilization of critical path (not "all features")
Example: A service desk tool launches. 80% log in (vanity). Only 35% create tickets using the new category schema. Everyone else free-types. Reporting becomes useless.
Intervention: Field-level enforcement + redesigned category list + job aid + "top 10 examples."
Adoption lagging indicators (stable behaviour and quality). These confirm whether adoption is real and sustained.
What to measure
- Frequency:
- Weekly / monthly active users (WAU / MAU) for target roles
- Breadth:
- Adoption rate by team / location / role
- Depth:
- % Using advanced but essential features (approvals, workflows, integrations)
- Quality:
- Rrror rates, rework rates, exception rates, approval bounce-backs
- Sustainability:
- adoption maintained after 4–8 weeks and after reinforcement stops
Example: In procurement digitization:
- Week 1: purchase requests created digitally = 60%
- Week 6: stable at 92%
- But exceptions ("urgent offline request") still at 18% in one site
That site hasn't adopted the discipline, only the tool.
Intervention: Tighten exception governance + root cause on "urgent" definition + leadership reinforcement.
The Four Data Engines: Surveys, System Usage, Helpdesk, Audits
You don't need perfect data. You need triangulation: multiple imperfect signals pointing to the same truth.
1) Surveys: the "why" behind behaviour
Surveys are best for:
- Clarity
- Confidence
- Perceived barriers
- Manager support
- Readiness gaps
Use them well:
- Keep them short (8–12 questions)
- Segment results (role, location, tenure, team)
- Track trends weekly/biweekly during transitions
- Include one open text question: "What is the biggest blocker right now?"
Example refinement loop: Survey shows low confidence for "Task 3: exception handling." You add a micro-learning + decision tree. Next pulse shows confidence improves, and helpdesk tickets on exceptions drop.
2) System usage analytics: the "what" people actually do
Usage data is best for:
- Adoption behaviour
- Drop-offs
- feature utilization
- Workarounds (indirectly)
What to track (practical set)
- Active users vs expected users (by role)
- Critical transaction counts (e.g., invoices posted, service requests closed)
- Cycle time in system (start-to-complete)
- Abandonment rates (started but not completed)
- Error events and validation failures
- Work done outside system (e.g., email approvals) where measurable
Example: A new HR workflow requires manager approvals in system. Usage shows approvals happening, but cycle time increases by 2.4 days. Root cause: managers can't find the approval queue easily.
Intervention: UI shortcut + email deep-link + training clip + manager nudges.
3) Helpdesk tickets: your early-warning radar
Helpdesk data is best for:
- Friction points
- Training gaps
- Access issues
- Process confusion
- Feature defects
What to measure
- Ticket volume per 100 users (normalize)
- Top categories (access, "how-to," errors, data issues)
- First contact resolution rate •Average time to resolve
- Repeat tickets (same user / same issue)
- Ticket spikes after releases or policy changes
Example: After go-live, tickets surge. But 60% are "password / role access" and 25% are "how to find X." That is not "resistance." That's provisioning + UX + job aids.
Intervention: Access cleanup + in-app guidance + searchable FAQ + floor-walkers.
4) Audits and compliance checks: adoption with integrity
Audits are best for:
- Whether people are following the process correctly
- Whether controls are working
- Whether exceptions are justified
What to measure:
- % Compliance to critical steps (sampling-based)
- Nonconformities by type (documentation, approvals, segregation of duties)
- Exception approvals: rate, rationale quality, approval authority adherence
- Rework triggered by audit findings
Example: A finance SOP requires three-way match. System usage shows invoices processed (adoption "looks" high). Audit shows 28% bypass match using "manual override." That's adoption without control dangerous.
Intervention: Tighten override permissions + retrain on scenarios + publish "override allowed only when…"
Turning Data Into Better Interventions: The Refinement Playbook
Data should not end in dashboards. It should end in decisions. Use this loop every 1–2 weeks during high-change windows:
Step 1: Spot the signal (what changed?)
- Confidence down in one team
- Drop-offs high at one step
- Ticket category spiking
- Audit failures rising
Step 2: Form a hypothesis (why is it happening?)
- Training didn't cover real scenarios
- Access incorrect
- Job aid missing at point of use
- Process step is too slow / too rigid
- Manager reinforcement absent
- Incentives misaligned
Step 3: Choose the smallest effective intervention
Pick from a tight set:
- Targeted comms (role-specific, scenario-based)
- Micro-training (5–10 minutes)
- Manager huddles with scripts
- Job aids / decision trees
- System fix or UX improvement
- Access / permission correction
- Governance changes (exception controls)
- Champions / floor support
Step 4: Re-measure and decide
- Did the metric move?
- Did a different metric worsen (unintended consequence)?
- Keep, adjust, or retire the intervention. Two Realistic Examples
Example 1: ERP rollout in an EPC company (procurement + stores + finance)
Situation: New ERP for purchase requests, GRN, invoice processing.
Leading readiness indicators
- Role clarity ("I know my new steps"): Stores 82%, Finance 51%
- Simulation pass rate (GRN posting): 74%
- Access correctness: 69% (permissions wrong in Finance)
- Sponsor activity: strong at HQ, weak at sites
Go-live decision: Delayed Finance go-live by 2 weeks, piloted two sites first.
Adoption leading indicators (Week 1–2)
- % Users completing first PR: 63%
- Drop-off at "cost center selection": high
- Helpdesk tickets: spike in "master data missing"
Interventions
- Fix cost center mapping + searchable lookup job aid
- Floor-walkers for 10 days at pilot sites
- Manager daily standups for blockers
Adoption lagging indicators (Week 6)
- Digital PR rate: 91%
- Invoice cycle time improved 18%
- Audit: overrides reduced from 22% to 6%
What made it work: readiness metrics prevented a bad launch; ticket and usage patterns guided the fixes.
Example 2: New member complaint process in a gym chain
Situation: Centralized complaint logging + escalation workflow.
Leading readiness indicators
- Staff confidence to log complaints: 58%
- Understanding of escalation rules: 44%
- SOP availability at front desk: inconsistent across centers
Interventions before launch
- 20-minute role-play training
- One-page escalation matrix at every desk
- "Top 10 complaint scenarios" cheat sheet
Adoption indicators after launch
- Week 1: complaints logged per center increased (good sign)
- Helpdesk tickets: low, but manager notes show staff "resolving verbally" without logging
- Audit sampling: 30% of verbal complaints not captured
Refinement
- Add mandatory "verbal complaint capture" field during shift closing
- Incentivize logging accuracy, not "low complaint count"
- Weekly dashboard by center: logged vs resolved vs reopened
Outcome: Complaint closure time improved; repeat complaints reduced.
A Practical "Minimum Viable Scorecard" You Can Start With
If you want a simple, high-signal scorecard, use this:
Readiness (Leading)
- % Role clarity (pulse survey)
- Simulation pass rate for top 5 tasks
- % Users provisioned correctly
- % Managers running enablement huddles
- Change saturation / workload risk index
Adoption (Leading + Lagging)
- % Users completing first successful transaction
- Active user rate (WAU / MAU) by role
- Critical path completion rate
- Drop-off and rework rates
- Helpdesk tickets per 100 users (top categories)
Integrity & Outcomes (Lagging)
- Audit compliance rate on critical controls
- Exception rate and override rate
- Cycle time, throughput, error cost
- customer / member impact metrics (where applicable)
Common Mistakes That Kill Measurement Value
- Vanity metrics masquerading as adoption: "Logins" are not adoption. "Training completed" is not readiness.
- No segmentation: Averages hide failure pockets. Always cut by role, location, team.
- Measuring too much, deciding too little: If the metric doesn't drive a decision, remove it.
- Punitive dashboards: If people fear the metrics, they game the metrics. Keep the tone diagnostic.
- No linkage to interventions: Metrics without action is performance theatre.
Closing Insight: Measure What You Intend to Change
Readiness and adoption metrics are not a reporting accessory. They are a control system for the human side of transformation.
When you measure the right leading indicators, you don't "manage resistance." You remove friction before resistance becomes identity.
When you measure adoption properly, you don't argue about whether the change "landed." You see it; step by step, team by team, behaviour by behaviour. And that's the point.
Not to prove you launched. To prove you changed how work gets done.
Categories: : Management